How Freddie Freeman has bounced back from a slow start
Freddie Freeman got off to an uncharacteristically slow start this year after having the best season of his career in 2020. Although it was an abbreviated 60-game season, for him to hit .341/.462/.640 last year and win the NL MVP after a particularly enervating battle with COVID-19 was remarkable.
Freeman, who will turn 32 in September, appeared to be on his way to earning another lucrative contract, assuming he wouldn’t show any glaring signs of decline in 2021.
However, so far this season, in what is the final year of his franchise-record eight-year, $135 million deal with the Atlanta Braves, Freeman’s overall output has fallen well short of what he’s produced for most of his career.
On May 8, he was in the midst of a career-worst 0-for-22 stretch before homering against the Phillies. Through Freeman’s first 32 games of the season, he was hitting .197/.333/.427 with a slightly above average 102 wRC+.
Over his last 16 games though, Freeman has begun to look a lot more like one of the elite hitters in the game that he’s been for the past decade. Since May 9, he is hitting .328/.431/.574 with a 173 wRC+.
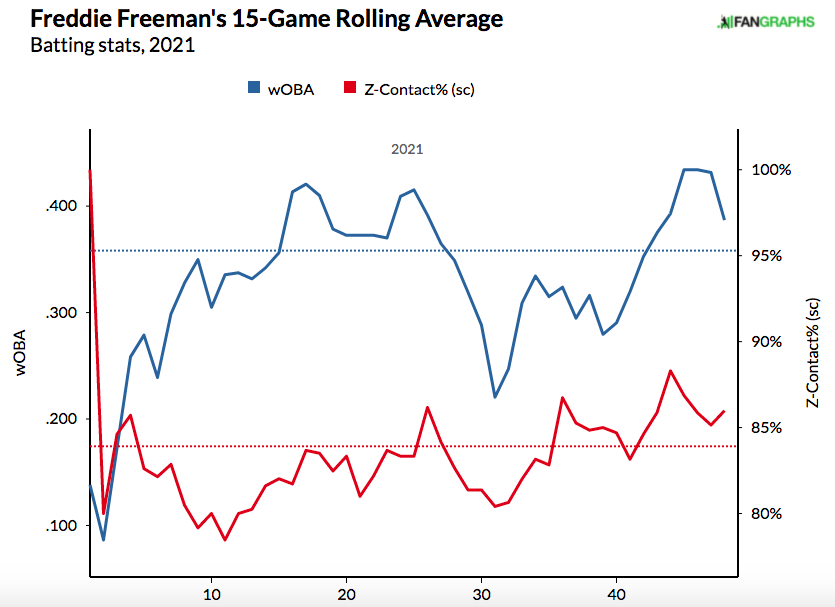
One of the biggest sources of Freeman’s uptick in production over the past several weeks has been that he’s making more contact on pitches in the strike zone.
Last year, Freeman whiffed on 15.2% of pitches thrown in the zone, which was his best rate of the Statcast era (since 2015). This year, he’s whiffing at pitches in the zone 2.1% more often. If the season ended today, that rate of 17.3% would actually be his second-best of the Statcast era. A big reason for that has been how much better he’s been since hitting a trough on May 7, which was his 31st
game of the season.

*wOBA assigns value to each method of reaching base, in terms of its impact on scoring runs.
As Freeman has made more contact on pitches thrown in the strike zone over the past few weeks, his wOBA has increased. Since May 9, only 14 MLB hitters have posted a higher wOBA than Freeman. In that span, he has posted the same number of walks (11) as strikeouts (11). Even before his breakout began on May 9, Freeman’s walk and strikeout total were identical (16), which was one of the biggest indicators he was due for a resurgence. Freeman has always been one of the more disciplined hitters in the sport, and his production is beginning to normalize, as a result.
Another number jumps out when looking at Freeman’s slow start in 2021. This season he is hitting just .229 against fastballs, which is a staggering decline from where he’s been his entire career.
Freeman batting average vs. fastballs by season
- 2021: .229
- 2020: .435
- 2019: .322
- 2018: .326
- 2017: .342
- 2016: .334
- 2015: .296
- 2014: .317
- 2013: .361
- 2012: .294
- 2011: .292
- 2010: .267
Batting average against fastballs is down across the league this season, mainly because pitchers are throwing harder than ever, but Freeman’s drop-off here has been enormous. Just think about this: From 2010-2020, opposing pitchers threw 13,009 fastballs to Freeman. In those 11 seasons, he hit .325 on such pitches. This season, he’s 96 points below that average.
Freeman has seen only 485 fastballs this season, which is a minuscule sample size compared to the rest of his career. Chances are, he’ll progress to the mean over the course of the season. Again, his performance over the last 16 games suggests he’s beginning to do so.
Since May 9, Freeman has gone 13-for-37 (.351) on fastballs with a .622 slugging percentage. The 13 hits on fastballs over his last 16 games are more than he had in his previous 32 games this season.
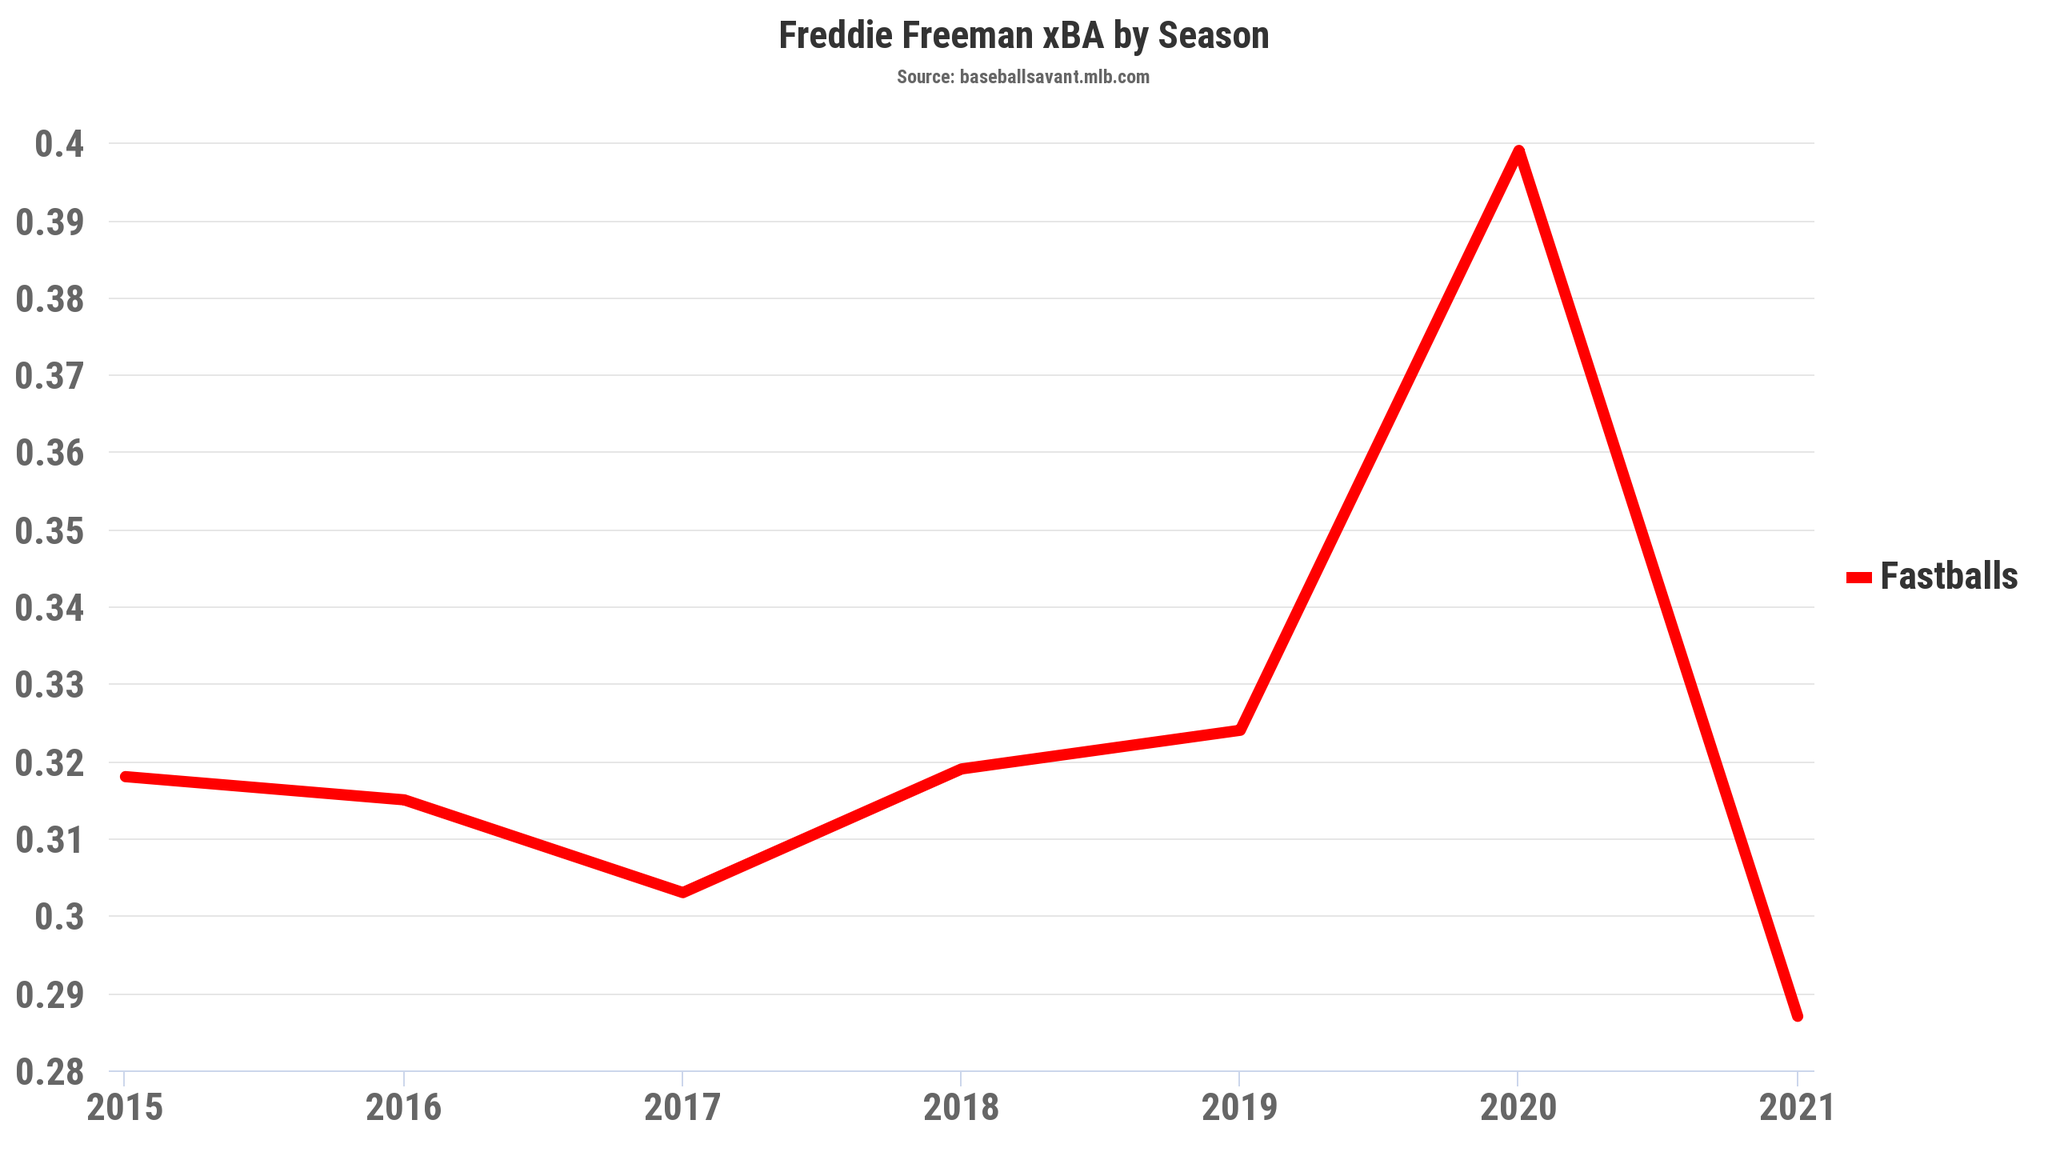
Part of the reason his average against fastballs has improved recently is that he’s hitting the ball on the ground far less often. This past April, he posted a 51% ground ball rate on fastballs, which was his highest percentage in any month since August 2013. In May, he’s down to 42.5%, which is still below his career average, but it’s caused his expected batting average against fastballs to jump from .264 in April to .309 in May.
For the season, Freeman has posted a .287 xBA against fastballs.

He has never had a season in which he’s been expected to hit below .300 against fastballs since xBA became an official stat in 2015. If he can avoid hitting the ball on the ground against heaters as often as he did in April, his xBA should continue to rise throughout the season.
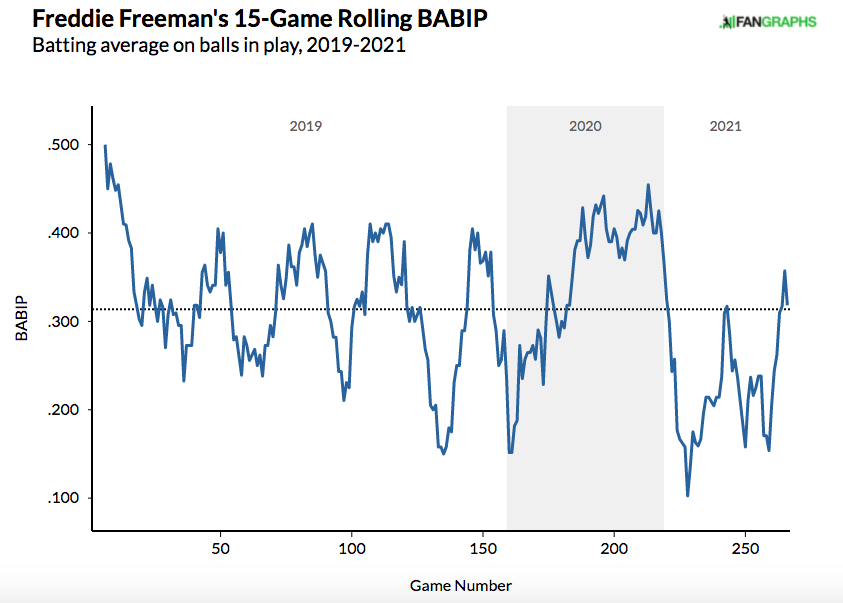
The other major contributing factor to Freeman’s pedestrian start this season was simply poor luck. From April 1-May 8, Freeman’s batting average on balls in play was .174, which ranked third-lowest in the league. Since May 9, his BABIP is up to .348, which is very close to his career average of .338.

BABIP tends to even out over time, which not only suggests Freeman was due for the recent breakout he’s experiencing, but also that his production over his last 16 games is relatively sustainable.
As mentioned before, his identical walk and strikeout rates will aid his production down the line. There is still a long time between now and the end of the season, but right now Freeman is on pace to post the second-highest walk rate and the second-lowest strikeout rate of his career.
Further, his average exit velocity (92.2) and hard-hit rate (50.7) would be the second-highest of his career. Both of those rank in the top-20 among MLB hitters this season.
One final metric that encapsulates Freeman’s poor luck to start this season is the difference between his expected weighted on-base average and his actual weighted on-base average. Like wOBA, xwOBA takes into account walks, strikeouts and quality of contact, but it removes defense from the equation. That helps make xwOBA more indicative of a player's skill than actual wOBA.
Among hitters who have batted at least 100 balls in play, only 10 of them have seen a greater difference between their xwOBA and wOBA than Freeman.
Similarly, only three hitters in baseball have a greater difference between their xBA and BA.
Greatest difference between xBA and BA
- 1. Kyle Tucker (HOU): -.068
- 2. David Bote (CHC): -.065
- 3. Charlie Blackmon (COL): -.058
- 4. Freddie Freeman (ATL): -.055
- 5. Marcell Ozuna (ATL): -.055
Freeman has been one of the unluckiest hitters in baseball so far in 2021. His plate discipline remains a strength and his quality of contact mostly resembles that of the rest of his career. Over his past 16 games, his results have begun to normalize. If he continues to make more contact on pitches in the strike zone and sustains his recently increased output against fastballs, Freeman will again finish the season as one of the top hitters in the sport.
